subset <- gapminder |>
filter(country %in% c("county1", "country2", "country3"))Homework 2
Instructions: General reminders
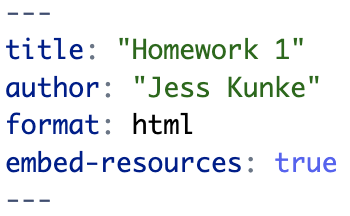
For this and all assignments you submit on Canvas: Don’t forget to include embed-resources: true in your YAML header. This way your HTML document will include any plots you made when you upload the document to Canvas. Adding this line to your YAML header should look something like this:
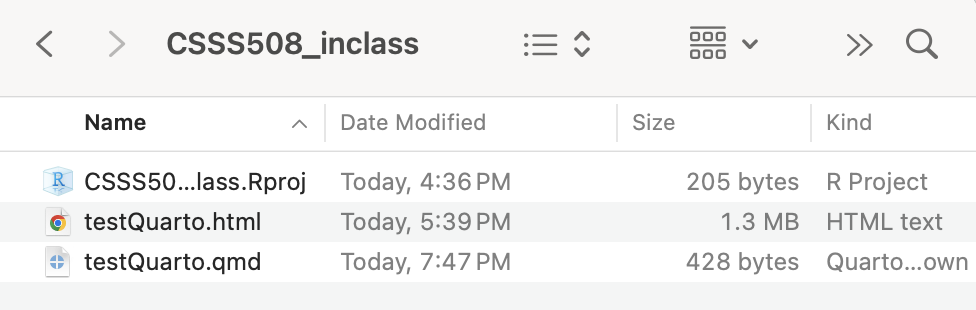
When you go to submit on Canvas, submit the .html and .qmd files that are already on your computer. When you render a Quarto (.qmd) file to HTML format and it opens a page in your browser, it looks like a webpage but it’s actually a file on your computer that has the extension .html. Instead of trying to print the HTML file from your browser, submit the .html and .qmd files already on your computer. Here’s a screenshot from an example in class today (Lecture 2): when I rendered the file testQuarto.qmd, it created a file called testQuarto.html in the same folder.
Instructions for Homework 2 specifically
In this homework, you’ll pose a question regarding the Gapminder dataset and investigate it graphically. Rather than using the gapminder package like we did in lecture, you’ll want to use the dslabs package1, which has a larger subset of the Gapminder data (i.e. more observations and variables).
- At the beginning of your document, write down a research question that is based on the Gapminder dataset (e.g., “How does population change over time in different countries?”)
- Create 3-6 plots to answer/investigate your research question. Consider histograms (
geom_histogram()), scatterplots (geom_point()), or lineplots (geom_line()). - Be sure all titles, axes, and legends are clearly labelled (no raw variable names).
- Include at least one plot with
facet_wrap()orfacet_grid(). - You can use other
geomslike bar charts, box plots, add meaningful vertical or horizontal lines, etc. You may find this data visualization cheat sheet helpful.
Your document should be pleasant for a peer to look at, with some organization. You must write up your observations in words as well as showing the graphs. Upload both the .qmd file and the .html file to Canvas.
Optional: If you’d like to compare several specific countries, you can adapt the following pseudo_code below to create a subset of the data with as many countries as you like. Replace "country1" et al. with the country name as it appears in the dataset. Use unique(gapminder$country) to see a complete list of all the countries available.:
Footnotes
Remember to install the package in your console first (not in your qmd file) and then load it with the library() function.↩︎